You
Here is my spending export for the year. Can you find the pattern?
Attachments: budget-2025.csv
ChatGPT
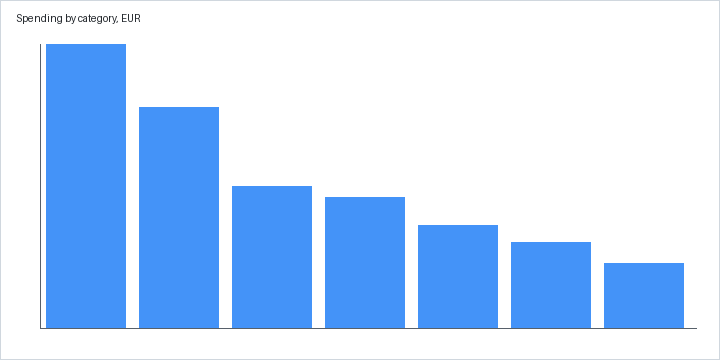
Grouped by category and sorted by total:
| Category | EUR | Share |
|---|---|---|
| Groceries | 820 | 31% |
| Eating out | 640 | 24% |
| Transport | 410 | 15% |
| Subscriptions | 380 | 14% |
| Everything else | 420 | 16% |
The interesting line is subscriptions: 380 EUR across eleven separate charges, and four of them renewed within the same week, which is why that month looked like an anomaly.
You
ChatGPT
Eating out tracks weeks when groceries dropped below 60 EUR, so the two are the same behaviour seen from different sides rather than two independent problems. Cutting the category directly tends to fail; planning two more meals at home usually moves both.